Artículo publicado en el Journal of Neural Engineering
Potential EEG biomarkers of sedation doses in intensive care patients unveiled by using a machine learning approach
Fernando Monasterio3,4, Carmen Torrecilla3,4, Paloma Pulido2,4 and Guillermo J Ortega4,5
1 Clinical neurophysiology, Hospital Universitario de la Princesa, Madrid, España
2 Neurosurgery, Hospital Universitario de la Princesa, Madrid, España
3 Intensive Care Unit, Hospital Universitario de la Princesa, Madrid, España
4 Instituto de Investigación Sanitaria, Hospital de la Princesa, Madrid, España
5 CONICET, Buenos Aires, Argentina
6 Author to whom any correspondence should be addressed.
7 Fundación de Investigación Biomédica Hospital de la Princesa, Hospital Universitario La Princesa, C/Diego de León, 62, Madrid 28006, España.
E-mail: ancor.sanz@gmail.com
JNE: Accepted for publication 31 January 2019
Published 26 February 2019
Artículo publicado en el Journal of Neural Engineering
Abstract
Objective. Sedation of neurocritically ill patients is one of the most challenging situation in ICUs. Quantitative knowledge on the sedation effect on brain activity in that complex scenario could help to uncover new markers for sedation assessment. Hence, we aim to evaluate the existence of changes of diverse EEG-derived measures in deeply-sedated (RASS-Richmond agitation-sedation scale ?4 and ?5) neurocritically ill patients, and also whether sedation doses are related with those eventual changes. Approach. We performed an observational prospective cohort study in the intensive care unit of the Hospital de la Princesa. Twenty-
six adult patients suffered from traumatic brain injury and subarachnoid hemorrhage were included in the present study. Long-term continuous electroencephalographic (EEG)
recordings (2141 h) and hourly annotated information were used to determine the relationship between intravenous sedation infusion doses and network and spectral EEG measures. To
do that, two different strategies were followed: assessment of the statistical dependence between both variables using the Spearman correlation rank and by performing an automatic classification method based on a machine learning algorithm. Main results. More than 60% of patients presented a correlation greater than 0.5 in at least one of the calculated EEG measures with the sedation dose. The automatic classification method presented an accuracy of 84.3% in discriminating between different sedation doses. In both cases the nodes’ degree was the most relevant measurement. Significance. The results presented here provide evidences of brain activity changes during deep sedation linked to sedation doses. Particularly, the capability of network EEG-derived measures in discriminating between different sedation doses could be the framework for the development of accurate methods for sedation levels assessment.
Keywords: EEG, ICU, sedation, brain networks, machine learning
Introduction
Sedation of critically ill patients is a routine intervention in intensive care units (ICU). An appropriate sedation level is critical to ensure patient comfort and maneuverability while maintaining its safety. Unfortunately, quantitative sedation assessment of ICU patients still lack for a gold standard. Several works have highlighted the inappropriate titration of sedatives in ICU patients, whether being oversedation or undersedation (for review [1]). Incidence of non-optimal sedation may reach 75% [1] which highly affects patients’ morbidity and mortality [2–6]. These facts reveal the need for an appropriate procedure capable of correctly assessing the patient’s sedation levels. Currently, the most employed methodologies are based on neurological scales, as it is the Richmond agitationsedation scale (RASS), for instance. However, these scales cannot be evaluated continuously and are highly dependent on the critical care personnel expertise. Hence, development of a quantitative and objective sedation level assessment of critically ill patients is certainly mandatory.
In view of that, several continuous monitoring systems have been proposed to assess sedation levels, some of them using the heart rate variability [7, 8], while others grounded on electroencephalographic (EEG) measures [9–12]. The Bispectral index (BIS), and the Entropy to a lesser extent, are perhaps the most widely used of such systems fully validated in situations under general anesthesia. None of them, however, have proven to be totally reliably in ICU patients. In the case of the BIS for instance, contradictory reports have been published whether in favour [13] or against its use [14]. These controversies could be explained by the complex scenario found in the ICUs, in which several sedatives at varying doses are used during long-term periods. More research is certainly needed in the field of ICU sedation, especially in the particular case of deep sedation (RASS ?4 and ?5).
Although not exclusively focused on sedation assessment, EEG has shown to be very useful when used on ICU patients. Specifically, continuous EEG (cEEG) has been widely employed for detection of non-convulsive seizures (for review [15]), delayed cerebral ischemia detection [16, 17], and for automatic classification of EEG segments depending on the EEG pattern [18]. The analysis of cEEG recordings oriented towards sedation assessment is generally based on the spectral analysis. Very few studies have addressed the sedation issue under the synchronization and network analysis perspective. One seminal exception is the work of Koskinen et al [19] which studied the anesthetic effects—induced by propofolon brain synchronization evaluated through the phase synchronization (PS). Since then, only few works have described how anesthetics modulate brain connectivity [19–23], but none of them for ICU cases.
The above mentioned issues of sedation assessment are particularly true in neurocritical ICUs because these patients present several complications, requiring specific and precise sedation [24]. In view of that, we propose to evaluate the existence of changes of diverse EEG-derived measures, including those derived from network analysis, under the most complex scenario: long-term deeply-sedated neurocritically ill patients (RASS levels between ?4 and ?5) and determine whether those are linked to sedative dose changes.
Methods
Continuous scalp EEG recordings were obtained from 26 patients (11 women) admitted to the hospital de la Princesa’s ICU during the period from October 2015 till March 2017, summarized in supplementary material 1 (stacks.iop.org/ JNE/16/026031/mmedia). This research was approved by the Ethical Committee of the Hospital de la Princesa. Informed consents were obtained from all the patients’ relatives. Inclusion criteria were: both sex patients, age ? 18 years, critically ill patients suffering from traumatic brain injury (TBI) or subarachnoid hemorrhage (SAH), presenting RASS levels between ?4 and ?5 during the continuous recordings and mechanically ventilated patients. Exclusion criteria were: ICU stay shorter than a week, no continuous EEG (cEEG) recordings performed. An overall of 3111 h of video and hourly annotated clinical information of patients were analyzed, including 2141 h of cEEG. Although continuous, the cEEG presents some gaps due to several factors such as: CT scans, surgery, interruption in the recording software, etc.
EEG
Continuous EEG recordings were performed using 19 scalp electrodes according to the international 10–20 system. The electrodes placement was made using collodion to ensure long-term attachment. All derivations were referenced to (Fz + Cz + Pz)/3. In this way, eight electrodes for each lateral side were employed, yielding a total of 16 EEG monopolar recordings for each patient. EEG recordings were continuously acquired for a period of 5.2 ± 2.3 d at a sampling frequency of 500 Hz (NeuroWorks, XLTEK®, Oakville, ON, Canada), exported to ASCII at 200 Hz, band-pass filtered in the range 0.5–40 Hz [25]. Epochs containing artifacts such as saturated electrical activity, electrode displacements, among others, were discarded. Those epochs were identified by an expert neurophysiologist and posterior inspection of videotaped recordings. Continuous recordings were divided in nonoverlapping temporal windows of 5 s (2500 data points) in which several network measures were calculated. In the same fashion, spectral measures were also calculated as positive controls of the sedation-induced changes on the EEG [26, 27].
Numerical analysis
All the numerical analysis was carried out using the R software, either using standard libraries (stated below) or with homemade scripts.
Network measures. A synchronization measure between every pair of electrodes’ signals was calculated by using the PS, estimated through the use of the mean phase coherence [28, 29], defined as:

where Fi n, Fi m are the instantaneous phases of the electrode time series n and m respectively, and Nwin is the number of points in the analyzed temporal window. PSmn has values between 0 and 1, such that a PSmn = 1 implies a fully synchronized interaction. Phase synchronization is a well-established
method for estimating functional connectivity in scalp EEG recordings [30, 31]. By using PS, an estimation of the connectivity’s strength between each pair of electrode recordings was obtained. A network of 16 electrodes—nodes—with their corresponding connectivity—links—was finally built using
the R package igraph, as it was done in [28]. In order to determine whether a link between every pair of contacts actually exists or not (adjacency or connectivity matrix), a threshold of 0.5 was imposed such that when the value of PS was greater than 0.5 the links was take into account and discarded otherwise [31]. Once the network was constructed, several measures were calculated, namely:
– The nodes’ degree (ND) of the i node is the number of nodes connected to it, calculated as follows,
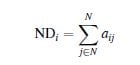
where N is number of network’s nodes and aij are the binary element of the adjacency matrix.
Note that ND is calculated for every network node instead of providing a network average.
– The density of links (DoL) is the ration between the actual number of links and the number of all possible links of the network. This measure provides information of the whole network connectivity.
– The average path length (APL) provides global information of how fast is the communication transfer
through network nodes, it is defined as
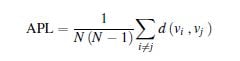
where N is the number of nodes and d (vi , vj ) is the shortest path between nodes vi and vj.
– The average clustering coefficient (CC) measures how well, on average, neighbors nodes of a particular node are connected between them, it is calculated as follows,
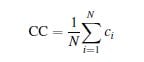
being N the number of nodes and ci the clustering coefficient of node i.
– The number of clusters (NC) determines the number of connected components in the network. Further details for network calculations can be found in [32].
Spectral measures.
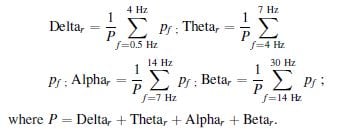
In every 5 s temporal window and for each electrode’s recordings, a traditional frequency bands decomposition—Delta (0.5–4 Hz), Theta (4–7 Hz), Alpha (7–14 Hz) and Beta (14–30 Hz)—was performed. The relative spectral power in each band, that is, the ratio of the spectral band power to the total power was used instead,
according to:
We also evaluated the spectral entropy (SE), which is the Shannon entropy of the full signal power spectrum and it was calculated as an indicator of the signal spectral content [33]. The SE was calculated in the following way. Firstly
the normalized power spectrum nPSi was estimated for each electrode’s time series xi
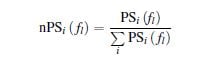
where PSi( f l) is the power spectrum of xi and the sum runs all over the full spectrum of frequencies f l. Secondly, the Shannon entropy of this ‘probability distribution’ was calculated
![]()
where SEi is the spectral entropy for channel i. The average of the SE over a set of electrodes i.e. the whole network electrodes or a particular region, was finally calculated as
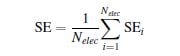
where Nelec is the total number of electrodes considered.
Sedation
In order to determine whether EEG changes during deep sedation exist and if these changes are actually linked to doses of continuously infused sedatives, we used the hourly annotated sedative doses information as an independent variable. Other drugs administered, as bolus, were not considered since the EEG epochs with bolus administration were discarded, as explained in the next section. From now on sedation and sedation doses will be used as equivalent terms. Intravenous sedation infusion (ml h?1) was written down hourly and adjusted to ?g/kg/h. In particular, the combination of intravenous sedation infusion of both propofol and midazolam was used as an index of sedative blood concentration since linear relationships between infusion doses of propofol [34] and midazolam [35] with their blood concentration it is known to exist. Fentanyl was administered to all patients in continuous and equivalent doses, consequently its effect on EEG changes was discarded.
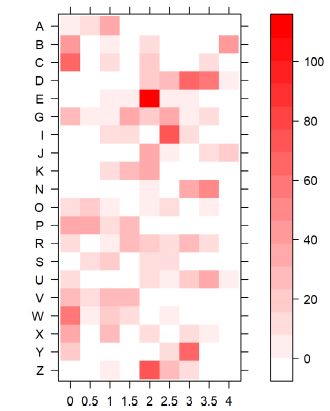
Continuous infusion of midazolam and propofol (?g/kg/ min) annotated every hour were converted to discrete variables by grouping similar doses in the following way: For midazolam: 0 for doses <1 ?g/kg/min, 1 for doses between 1 ?g/kg/min and 2 ?g/kg/min, 2 for doses between 2 ?g/ kg/min and 3 ?g/kg/min, and so on, and for propofol: 0 for doses <10 ?g/kg/min, 1 for doses between 10 ?g/kg/min and 20 ?g/kg/min, 2 for doses between 20 ?g/kg/min and 30 ?g/ kg/min, and so on. To obtain a single sedation variable, the mean of the discrete values for midazolam and propofol, at each window was calculated assuming equally contribution of both sedatives. The resulting values were then categorized into 9 levels: 0, 0.5,1, 1.5, 2, 2.5, 3, 3.5, 4 such that values greater than 4 were included in the last level. The distribution of sedation levels and the number of time windows per level across patients is shown in figure 1.
Thirty-minute temporal windows of discretized time
With the objective to compare dose levels with EEG measures (detailed in the following paragraph) temporal windows of 30 min were used. In doing that, every hourly sedation level was replicated in both 30 min windows. This approach allows maintaining the variance of the EEG measures while duplicating the sedation sampling rate. In those cases where either bolus administration or patient handling was performed, the corresponding 30 min windows were eliminated from the analysis. Annotated information regarding bolus and/or patient handling was always confirmed by video recordings. In order to determine the association between sedation and EEG variables two approaches were used: correlation and automatic classification.
Correlation
To evaluate the correlation between sedation and EEG variables the following procedure was implemented. First, in every 30 min window a mean value for each EEG measure was estimated. Taking into account that EEG measures were ‘sampled’ at 5 s steps, 360 values were used to determine its mean value. Second, a Spearman correlation between both time series—EEG measure and sedation was calculated, for each patient. Only Spearman’s rho > |0.5| were considered as significant. Spearman correlation was used because it is more general (monotonic relationship) in comparison with the usual Pearson correlation (linear relationship).
Automatic classification
As an alternative way of exploring the potential existence of a relationship between sedation and EEG measures, an automatic classification scheme was implemented by using two different strategies. On one hand, an intra-subject classification, by using all 30 min windows from each same patient in one SVM analysis, was implemented, producing one result per patient. On the other hand, an inter-subject classification, using all 30 min windows from all patients, was alternatively used, resulting in an overall classification result. Patients under constant sedation, that is, without fluctuations in the infusion sedation doses (F, H, L, M, Q, T) were not included in the intra-subject classification scheme though they were used for inter-subject classification. In both analyses an automatic classification method, the support vector machine (SVM) [36] (R package e1071) was used. SVM is a machine learning method that can perform general classification. In this particular case, a linear SVM allows constructing binary classifiers based on linear combination of different measures.
A one-against-one technique was used to allow multiclass classification. The implemented SVM calculation was accomplished as follows: from all the 30 min windows, two third of them were randomly selected to train the algorithm and the remaining one-third windows were used to test the classification after shuffling them. This last step solves the overfitting problem caused by the time series autocorrelation. In addition to the above mentioned validation set method, we performed another approach, so-called stratification, to avoid the bias produced by the potential uncorrected proportion of each class in both the training and the test dataset (supplementary material 2). Both approaches yielded similar classification accuracies. Specific parameters for the optimal SVM performance were obtained by using a grid search technique, that is, a ten-fold cross-validation on the training data, which has been used to overcome overfitting [37]. The bias due to the asymmetric sizes of dose levels was avoided by grouping underrepresented levels (which correspond to the higher dose levels >4). A confusion matrix of true and predicted values of the categorical variable ‘dose’ was constructed and both accuracy and kappa of this matrix were determined. Accuracy represents the percentage of values in the main matrix diagonal, i.e. the number of correct classifications as can be seen in table 1. Kappa index is the percentage of data points in the main diagonal of the matrix corrected by the agreement by chance. A unique random selection of temporal windows could lead to chance-affected results. In order to avoid this, we performed ten replicas of the SVM procedure. The percentages were the mean value ± standard deviation of these ten replicas. Statistical significance of accuracy, for all models, was assessed by using permutation tests. In all cases, classification accuracy based on real data sets differ significantly from those obtained from the random distribution, as can be observed in supplementary material 3.
Results
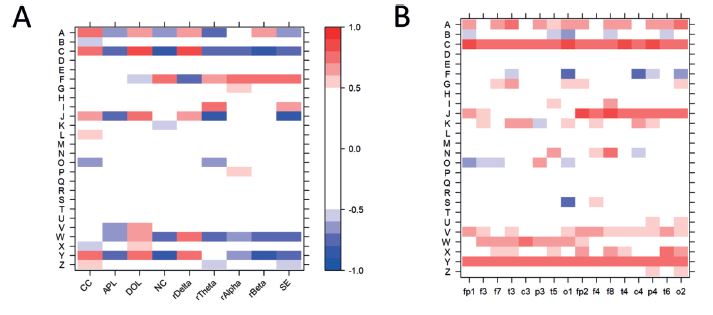
Heatmaps of correlations between EEG measures and sedation are represented in figures 2 and 3. Correlations between both spectral and network measures with sedation, for each patient, is represented in figure 2(A). Sixteen patients (62%) presented correlations in at least one measure above the threshold (rho > |0.5|), being CC the measure most frequently correlated with sedation (n = 9). Correlations between electrode’s ND and sedation, for every patient, are represented in figure 2(B). Seventeen patients (65%) presented at least one electrode with correlation above the threshold. Channel O1 and O2 were the most correlated with sedation in most patients, 11 and ten patients, respectively.
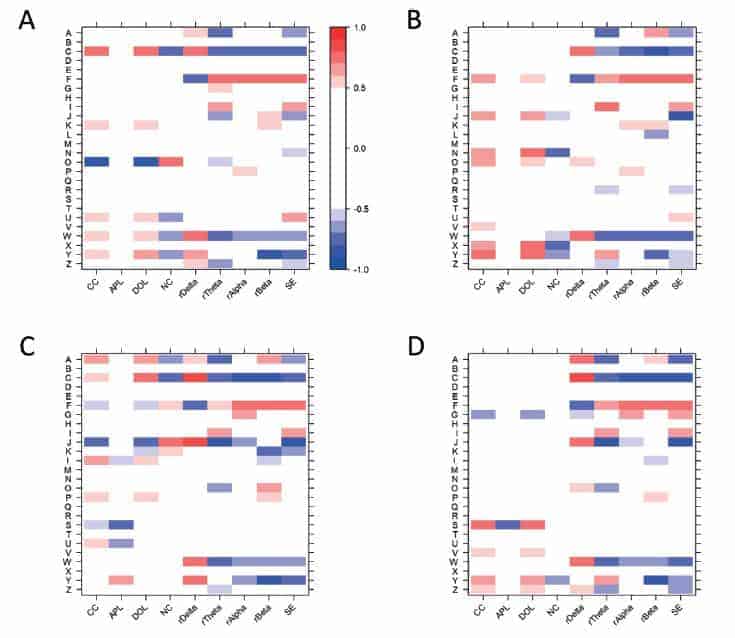
Higher correlation of ND, as compare to spectral and network measures, might be explained by the spatial information provided by ND, since ND values are calculated for each particular electrode instead of averages in the case of the other network and spectral measures. The underlying pathologies—TC and SAH—present localized lesions which may affect the EEG activity in the form of artifacts. Therefore, to better understand the contribution of cortical regions, heatmaps of spectral and network measures were calculated for each quadrant of the electrodes distribution (figure 3). The percentage of patients with above-the-threshold correlation was 54% for the anterior left quadrant (Fp1, F3, and F7) (figure 3(A)), 65% for the anterior right quadrant (Fp2, F4, and F8) (figure 3(B)), 58% for the posterior left quadrant (P3, T5, and O1) (figure 3(C)), and 54% for the posterior right quadrant (P4, T6, and O2) (figure 3(D)). The measures most correlated with sedation were SE for anterior left and right quadrants, rBeta for posterior left and SE and rTheta for posterior right.
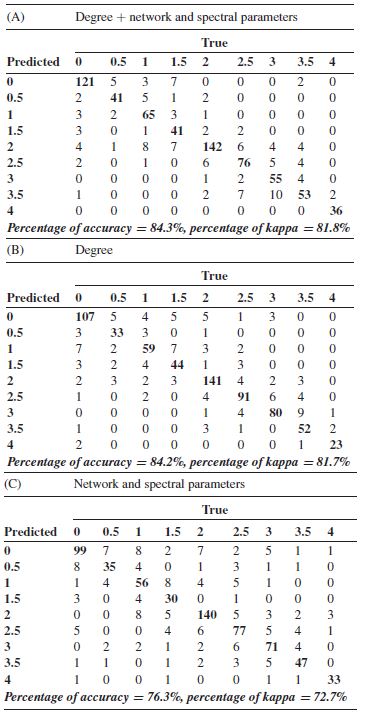
Correlations results suggest that not a unique measure is able to evaluate the sedation doses. Thus, a model of prediction was built by using the SVM methodology. We applied SVM for all patients using together the electrodes’ ND, and the spectral and network measures. As can be seen in the confusion matrix of table 1(A), in most cases, the values remain in the diagonal which implies that the predicted values correspond to true values. The average of ten replications reached an accuracy of correct classification of 84.3% ± 0.01 and a kappa of 81.8% ± 0.02, shown in table 1(A). Regarding the relevance of the different features in the SVM model, we found that the degree of t6, t4 and t3 electrodes presented the highest weight. Further detail can be found in supplementary material 4.
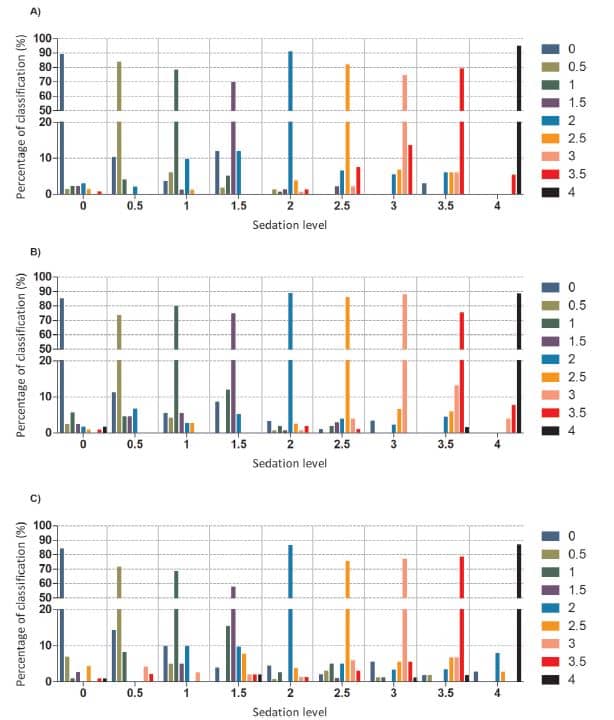
With the aim to determine the role of the evaluated measures we performed the SVM for the same groups of measures used in the correlation analysis. Table 1(B) shows the result of SVM analysis for the ND case: 84.2% ± 0.01 of accuracy and 81.7% ± 0.01 of kappa. The features with the highest weight were the same ones found in the previous model, further details can be found in supplementary material 4. For the case of spectral and network measures for the entire set of electrodes, the result was 76.3% ± 0.01 of accuracy and 72.7% ± 0.01 of kappa, reproduced in table 1(C). The most relevant features of this model were SE, rDelta and rTheta, although the standard deviation after ten replicas was higher than those obtained in the above presented SVM models. Further details can be found in supplementary material 4. The percentages of correct classification for each sedation group of all the evaluated measures (figure 4(A)), ND (figure 4(B)) and spectral and network (figure 4(C)) were over 50% and the misclassified time windows were mainly located in close groups and did not reach more than 11% -lower than the accuracy by chance—for each category. We determined the percentages of accuracy and kappa for the network measures without considering ND, and for the spectral measures in order to know how they separately performed the SVM, yielding 52% ± 0.02 of accuracy and 44.4% ± 0.02 of kappa
for network and 61.2% ± 0.02 of accuracy and 55.3% ± 0.02 of kappa for spectral. Further details of the training and test set errors of all the final models used above as well as other metrics of the model performance can be found in in supplementary material 5. Finally, details of the features weight for network measures without considering ND and for spectral measures can be found in supplementary material 4.
SE = spectral entropy; rDelta, rTheta, rAlpha and rBeta are the relative power of each frequency band.
We also performed SVM for spectral and network measures in the same model separately for: anterior left quadrant, anterior right quadrant, posterior left quadrant, and posterior right quadrant. For the network and spectral measures together we obtained a mean accuracy of 64.9% ± 0.02, 69.9% ± 0.02, 72.8% ± 0.01, 65.4% ± 0.01 and a mean kappa of 59.5% ± 0.02, 65.2% ± 0.02, 68.6% ± 0.01, 60% ± 0.01, respectively; for the network measures, a mean accuracy of 37.4% ± 0.01, 28.4% ± 0.02, 29.6% ± 0.01, 34.4% ± 0.01, and a mean kappa of 27.7% ± 0.02, 11.3% ± 0.02, 16.2% ± 0.01, 22.8% ± 0.01, respectively; and for the spectral measures, a mean accuracy of 62.1% ± 0.02, 58.4% ± 0.02, 60.3% ± 0.03, 57.5% ± 0.02, and a mean kappa of 56.2% ± 0.02, 51.9% ± 0.02, 54.1% ± 0.03, 50.9% ± 0.02, respectively. Further details of the features weight can be found in supplementary material 4.
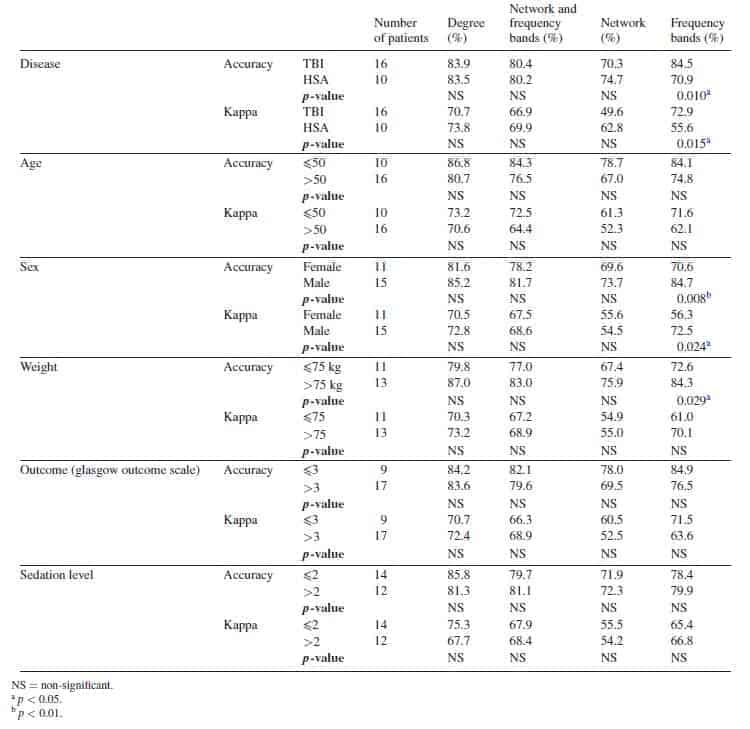
Results of SVM for each patient can be found in supplementary material 6. Contrary to the results found in the correlation analysis, SVM levels were similar in all patients, all performing with elevated percentages, and only those with low number of sedation categories presented low percentages. However, in order to better characterize the potential influencing factors in the SVM classification, we grouped the patients according to their demographic characteristics— disease (TBI or SAH), age (?50 or >50), sex, weight (?75 kg or >75 kg), outcome (glasgow outcome scale (GOS) ?3 or GOS >3) and the mean sedation level (?2 or >2)—in order to compare them (table 2). None of the patients’ characteristics presented significant differences in the SVM accuracy or kappa, except from the frequency bands for disease, sex and weight, in which the TBI, males and weight over 75 kg presented a higher classification accuracies.
Discussion
All patients in our study presented constant RASS levels (?4 and ?5) during the entire recording time, implying deep sedation. Our results suggest that even under such conditions fluctuations in EEG-related measures exist due to changes in sedative doses. This happens for several spectral and network measures calculated upon the EEG activity. This conclusion is based on the results obtained by using a classical correlation technique and a machine learning method, as it is the SVM.
The reported findings are in accordance with previous studies that demonstrate the relationship between brain connectivity and sedation [19–23] and also between sedation and the EEG spectral bands [26]. Particularly related to our findings is the study of Veselis et al [27] in which they assessed the effects of midazolam on the EEG of ICU patients. They showed the existence of high correlations between Beta and spectral edge frequency with sedation levels, although no correlation was found with the theta band. It is noteworthy that none of these previous works were based on the analysis of network measures of longterm ICU patients recordings, as it was done here.
Patient variability found in the correlation analysis may be explained by its constant sedation during the recording, or due to a saturation phenomenon, particularly in patients with high doses, or alternatively, due to a lack of response of the cortex caused by the main pathology. Differences between quadrants in terms of correlation could support the last hypothesis, i.e. different types and localizations of the pathology hampers the appropriate EEG recording and the correlation with sedation. This may also explains why none of the patients’ demographic characteristics clearly present a relationship with correlation results. In this sense, the fact that patients with higher sedation levels (>2), for instance patients J and Y also presented higher correlations, and patients with lower sedation levels (<2), patients S and T, had no correlation above the threshold, partially do reject the above explained saturation phenomenon. Even the outcome and the type of pathology seems to have no influence over correlation because only patients S, V, Y, and Z present similar characteristics (TBI and a GOS (< 3) and similar correlation results in posterior right quadrant but there are other patients with the same characteristics with a similar correlation pattern.
Other works have presented the utility of SVM in sedation classification using heart rate variability [7, 38] or EEG [12].
In the present study, SVM analysis support the correlation results since the ND presented the best performance as compare with the other measures, with equivalent percentages to the model that includes all the measures. These results were even better than the ones obtained from the model including the network, except the degree, and spectral measures. When analyzed separately, spectral measures performed better than the networks (except degree) measures, which could mean that they require a broad spatial representation rather than averaged values. The poor performance of the SVM analysis of the network measures per quadrant could support that hypothesis. It should be noted that the SVM results of both intra-subject and inter-subject were similar and none of the patient characteristics presented significant differences, in line with the correlation results, except from those obtained from the frequency bands. These facts strengthen the findings demonstrating the existence of a general model for all the patients and ruling out the potential bias introduced in the SVM due to different recording length of some patients, as noted in [7] or even due to different demographic characteristics.
This is not the first study connecting drug doses and EEG activity. Correlation between propofol and midazolam doses with EEG-based BIS values during general anesthesia in healthy volunteers has been demonstrated [39–41]. However, several limitations of the EEG-based BIS are known under general situations [42] and in particular for the case of ICU patients [43]. Some of our patients (patient J and L) were also monitored with BIS and their analysis revealed no correlation with drugs levels (data not shown). This fact cannot be related to particular conditions of these patients since both presented different levels of correlation. Moreover, we calculated proxies of other commercial EEG-based measures such as response and state entropies [11, 44], which also failed to reach significant results (data not shown).
Some of the several limitations inherent to this kind of work are worth to mention. The low number of analyzed patients was solved by using long-term recordings. Another issue which should be mentioned is that EEG recordings were performed in the ICU which is not free of complications even though extreme caution had been taken in removing artifacts by using the annotated and videotaped information. It is noteworthy that a high density EEG, mainly in network parameters, could have provided a better approach. However, continuous EEG recording requires individually attached electrodes on the scalp due to patient handling, which it is very difficult to perform it in clinical practice beyond routine montage. Additionally, the effect on the EEG of clinical complications such as vasospasm [16] or status epilepticus (for review [15]) among others, were not considered.
Lastly, it should be mentioned that what we have addressed here actually is the association between sedative dose fluctuations and EEG recordings in an attempt to provide a first step in the search of new markers of sedation.
Conclusion
The tight association between network EEG measures and the elevated percentage of prediction assessed using the automatic classification algorithm provides evidences of brain activity changes during deep sedation stages. This fact reveals the need for a proper sedation assessment under these conditions and, indeed, could provide the bases for adequately evaluate sedation levels in complex environments such as the ICU. However, further studies should be performed in order to compare the presented network measurements with sedation levels.
Acknowledgments
This work was funded by grants from Instituto de Salud Carlos III, through PI10/00160 project and PI12/02839 partially supported by Fondo Europeo de Desarrollo regional (F E D E R) and from Mutua Madrileña. A S-G is the recipient of a postdoctoral fellow from Mutua Madrileña. M P-R is the recipient of an Ayudante de investigacion fellowship form Comunidad de Madrid.
Ethical standards
The study has been approved by the La Princesa hospital’s ethics committee.
Conflicts of interest
The authors declare that they have no conflict of interest.
ORCID iDs
Ancor Sanz-García https://orcid.org/0000-0002-5024-5108
References
[1] Jackson D L, Proudfoot C W, Cann K F and Walsh T S 2009 The incidence of sub-optimal sedation in the ICU: a systematic review Crit. Care 13 R204
[2] Fraser G L and Riker R R 2007 Comfort without coma: changing sedation practices Crit. Care Med. 35 635–7
[3] Jacobi J et al 2002 Clinical practice guidelines for the sustained use of sedative and analgesics in the critically ill adult Crit. Care Med. 30 119–41
[4] Tallgren M, Pettila V and Hynninen M 2006 Quality assessment of sedation in intensive care Acta Anaesthesiol.
Scand. 50 942–6
[5] Carrasco G 2000 Instruments for monitoring intensive care unit sedation Crit. Care 4 217–25
[6] Kollef M H, Levy N T, Ahrens T S, Schaiff R, Prentice D and Sherman G 1998 The use of continuous i.v. sedation is associated with prolongation of mechanical ventilation Chest 114 541–8
[7] Nagaraj S B, McClain L M, Zhou D W, Biswal S, Rosenthal E S, Purdon P L and Westover M B 2016
Automatic classification of sedation levels in ICU patients using heart rate variability Crit. Care Med. 44 e782–9
[8] Bradley B D, Green G, Ramsay T and Seely A J 2013 Impact of sedation and organ failure on continuous heart and respiratory rate variability monitoring in critically ill patients: a pilot study Crit. Care Med. 41 433–44
[9] Hajat Z, Ahmad N and Andrzejowski J 2017 The role and limitations of EEG-based depth of anaesthesia monitoring in theatres and intensive care Anaesthesia 72 38–47
[10] Viertiö-Oja H et al 2004 Description of the entropy algorithm as applied in the Datex-Ohmeda S/5 entropy module Acta Anaesthesiol. Scand. 48 154–61
[11] Liang Z, Wang Y, Sun X, Li D, Voss L J, Sleigh J W, Hagihira S and Li X 2015 EEG entropy measures in anesthesia Frontiers Comput. Neurosci. 9 16
[12] Nagaraj S B, Mcclain L M, Boyle E J, Zhou D W, Ramawamy S M, Biswal S, Akeju O, Purdon P and Westover B 2018 Electroencephalogram based detection of deep sedation in ICU patients using atomic decomposition IEEE Trans. Biomed. Eng. 65 2684–91
[13] Roustan J P, Valette S, Aubas P, Rondouin G and Capdevila X 2005 Can electroencephalographic analysis be used to determine sedation levels in critically ill patients? Anesth.
Analg. 101 1141–51
[14] Bilgili B, Montoya J C, Layon A J, Berger A L, Kirchner H L, Gupta L K and Gloss D S 2017 Utilizing bi-spectral index (BIS) for the monitoring of sedated adult ICU patients: a systematic review Minerva Anestesiol. 83 288–301
[15] Friedman D, Claassen J and Hirsch L J 2009 Continuous electroencephalogram monitoring in the intensive care unit Anesth. Analg. 109 506–23
[16] Claassen J, Hirsch L J, Kreiter K T, Du E Y, Connolly E S, Emerson R G and Mayer S A 2004 Quantitative continuous EEG for detecting delayed cerebral ischemia in patients with poor-grade subarachnoid hemorrhage Clin.
Neurophysiol. 115 2699–710
[17] Rots M L, van Putten M J A M, Hoedemaekers C W E and Horn J 2016 Continuous EEG monitoring for early detection of delayed cerebral ischemia in subarachnoid hemorrhage: a pilot study Neurocrit. Care 24 207–16
[18] Agarwal R, Gotman J, Flanagan D and Rosenblatt B 1998 Automatic EEG analysis during long-term monitoring in the ICU Electroencephalogr. Clin. Neurophysiol. 107 44–58
[19] Koskinen M, Seppänen T, Tuukkanen J, Yli-Hankala A and
Jäntti V 2001 Propofol anesthesia induces phase synchronization changes in EEG Clin. Neurophysiol. 112 386–92
[20] Boly M et al 2012 Connectivity changes underlying spectral EEG changes during propofol-induced loss of consciousness J. Neurosci. 32 7082–90
[21] Ranft A et al 2016 Neural correlates of sevoflurane-induced unconsciousness identified by simultaneous functional magnetic resonance imaging and electroencephalography Anesthesiology 125 861–72
[22] Maksimow A, Silfverhuth M, Langsjo J, Kaskinoro K, Georgiadis S, Jääskeläinen S and Scheinin H 2014 Directional connectivity between frontal and posterior brain regions is altered with increasing concentrations of propofol PLoS One 9 e113616
[23] Wang K, Steyn-Ross M L, Steyn-Ross D A, Wilson M T and Sleigh J W 2014 EEG slow-wave coherence changes in propofol-induced general anesthesia: experiment and theory Frontiers Syst. Neurosci. 8 215
[24] Mirski M A and Hemstreet M K 2007 Critical care sedation for neuroscience patients J. Neurol. Sci. 261 16–34
[25] Sanz-Garcia A, Vega-Zelaya L, Pastor J, Torres C V, Sola R G and Ortega G J 2016 Network analysis of foramen ovale electrode recordings in drug-resistant temporal lobe epilepsy patients J. Vis. Exp. e54746
[26] Purdon P L, Sampson A, Pavone K J and Brown E N 2015 Clinical electroencephalography for anesthesiologists: part I: background and basic signatures Anesthesiology 123 937–60
[27] Veselis R A, Reinsel R, Marino P, Sommer S and Carlon G C 1993 The effects of midazolam on the EEG during sedation of critically ill patients Anaesthesia 48 463–70
[28] Ortega G J, Menendez de la Prida L, Sola R G and Pastor J 2008 Synchronization clusters of interictal activity in the lateral temporal cortex of epileptic patients: intraoperative electrocorticographic analysis Epilepsia 49 269–80
[29] Mormann F, Lehnertz K, David P and Elger C E 2000 Mean phase coherence as a measure for phase synchronization and its application to the EEG of epilepsy patients Physica D 144 358–69
[30] Stam C J, Nolte G and Daffertshofer A 2007 Phase lag index: assessment of functional connectivity from multichannel EEG and MEG with diminished bias from common sources Hum Brain Mapp. 28 1178–93
[31] Vega-Zelaya L, Pastor J, de Sola R G and Ortega G J 2015 Disrupted ipsilateral network connectivity in temporal lobe epilepsy PLoS One 10 e0140859
[32] Sanz-Garcia A, de Sola R G, Vega-Zelaya L, Pastor J and Ortega G J 2016 Network theoretical approach to describe epileptic processes Advanced Biosignal Processing and Diagnostic Methods ed C Hintermüller (Rijeka: InTech) (https://doi.org/10.5772/63914)
[33] Sanz-Garcia A, Vega-Zelaya L, Pastor J, de Sola R G and Ortega G J 2017 Towards operational definition of postictal stage: spectral entropy as a marker of seizure ending Entropy 19 81
[34] Gepts E, Camu F, Cockshott I D and Douglas E J 1987 Disposition of propofol administered as constant rate intravenous infusions in humans Anesth. Analg. 66 1256–63
[35] Bleasel M D, Peterson G M and Dunne P F 1994 Plasma concentrations of midazolam during continuous subcutaneous administration in palliative care Palliat. Med. 8 231–6
[36] Chang C C and Lin C J 2011 LIBSVM: a library for support vector machines ACM Trans. Intell. Syst. Technol. 2 27
[37] Han H and Jiang X 2014 Overcome support vector machine overfitting in diagnosis Cancer Inform. 13 145–58
[38] Nagaraj S B et al 2017 Patient-specific classification of ICU sedation levels from heart rate variability Crit. Care Med. 45 e683–90
[39] Leslie K, Sessler D I, Schroeder M and Walters K 1995 Propofol blood concentration and the bispectral index predict suppression of learning during propofol/epidural anesthesia in volunteers Anesth. Analg. 81 1269–74
[40] Glass P S, Bloom M, Kearse L, Rosow C, Sebel P and Manberg P 1997 Bispectral analysis measures sedation and memory effects of propofol, midazolam, isoflurane, and alfentanil in healthy volunteers Anesthesiology
86 836–47
[41] Johansen J W and Sebel P S 2000 Development and clinical application of electroencephalographic bispectrum monitoring Anesthesiology 93 1336–44
[42] Lobo F A and Schraag S 2011 Limitations of anaesthesia depth monitoring Curr. Opin. Anaesthesiol. 24 657–64
[43] Sackey P V 2008 Frontal EEG for intensive care unit sedation: treating numbers or patients? Crit. Care 12 186
[44] Aho A J, Yli-Hankala A, Lyytikäinen L P and Jäntti V 2009 Facial muscle activity, response entropy, and state entropy indices during noxious stimuli in propofolnitrous oxide or propofol-nitrous oxide-remifentanil anaesthesia without neuromuscular block Br. J. Anaesth. 102 227–33.