Identifying causal relationships between EEG activity and intracranial pressure changes (ICP) in neurocritical care patients”.
Ancor Sanz-García 4,6,7 , Miriam Pérez-Romero 4, Jesús Pastor1,4, Rafael G Sola 2,4, Lorena Vega-Zelaya 1, Fernando Monasterio 3,4,
Carmen Torrecilla 3,4, Gema Vega 3,4, Paloma Pulido2,4 and Guillermo J Ortega 2,4,5
1 Clinical neurophysiology, Hospital Universitario de la Princesa, Madrid, Spain
2 Neurosurgery, Hospital Universitario de la Princesa, Madrid, Spain
3 Intensive Care Unit, Hospital Universitario de la Princesa, Madrid, Spain
4 Instituto de Investigación Sanitaria, Hospital de la Princesa, Madrid, Spain
5 The National Scientific and Technical Research Council (CONICET), Buenos Aires, Argentina
Journal Of Neural Engineering;
© 2018 IOP Publishing Ltd
https://doi.org/10.1088/1741-2552/aadeea
Abstract
Objective. To explore and assess the relationship between electroencephalography (EEG) activity and intracranial pressure (ICP) in patients suffering from traumatic brain injury (TBI) and subarachnoid hemorrhage (SAH) during their stay in an intensive care unit.
Approach.
We performed an observational prospective cohort study of adult patients suffering from TBI or SAH. Continuous EEG-ECG was performed during ICP monitoring. In every patient,
variables derived from the EEG were calculated and the Granger causality (GC) methodology was employed to assess whether, and in which direction, there is any relationship between EEG and ICP.
Main results. One-thousand fifty-five hours of continuous multimodal monitoring were analyzed in 21 patients using the GC test. During 37.88% of the analyzed time, significant GC statistic was found in the direction from the EEG activity to the ICP, with typical lags of 25–50 s between them. When recordings were adjusted by sedation—perfusion and/or bolus—and handling, these percentages hardly changed. Significance. Long-lasting, continuous and simultaneous EEG and ICP recordings from TBI and SAH patients provide highly rich and useful information, which has allowed for uncovering a strong relationship between both signals. The use of this relationship could lead to developing a medical device to measure ICP in a non-invasive way.
Keywords: intracranial pressure, electroencephalography, Granger causality, traumatic brain injury, subarachnoid hemorrhage
1.- Introduction
Carmen Torrecilla 3,4, Gema Vega 3,4, Paloma Pulido2,4 and Guillermo J Ortega 2,4,5
1 Clinical neurophysiology, Hospital Universitario de la Princesa, Madrid, Spain
2 Neurosurgery, Hospital Universitario de la Princesa, Madrid, Spain
3 Intensive Care Unit, Hospital Universitario de la Princesa, Madrid, Spain
4 Instituto de Investigación Sanitaria, Hospital de la Princesa, Madrid, Spain
5 The National Scientific and Technical Research Council (CONICET), Buenos Aires, Argentina
Journal Of Neural Engineering;
© 2018 IOP Publishing Ltd
https://doi.org/10.1088/1741-2552/aadeea
Abstract
Objective. To explore and assess the relationship between electroencephalography (EEG) activity and intracranial pressure (ICP) in patients suffering from traumatic brain injury (TBI) and subarachnoid hemorrhage (SAH) during their stay in an intensive care unit.
Approach.
We performed an observational prospective cohort study of adult patients suffering from TBI or SAH. Continuous EEG-ECG was performed during ICP monitoring. In every patient,
variables derived from the EEG were calculated and the Granger causality (GC) methodology was employed to assess whether, and in which direction, there is any relationship between EEG and ICP.
Main results. One-thousand fifty-five hours of continuous multimodal monitoring were analyzed in 21 patients using the GC test. During 37.88% of the analyzed time, significant GC statistic was found in the direction from the EEG activity to the ICP, with typical lags of 25–50 s between them. When recordings were adjusted by sedation—perfusion and/or bolus—and handling, these percentages hardly changed. Significance. Long-lasting, continuous and simultaneous EEG and ICP recordings from TBI and SAH patients provide highly rich and useful information, which has allowed for uncovering a strong relationship between both signals. The use of this relationship could lead to developing a medical device to measure ICP in a non-invasive way.
Keywords: intracranial pressure, electroencephalography, Granger causality, traumatic brain injury, subarachnoid hemorrhage
One of the most common complications found in neurocritically ill patients is the increase of intracranial pressure (ICP). This is found in 55% of patients suffering from hemorrhage lesions [1] and in 54% of traumatic brain injury (TBI) patients [2]. Elevated ICP can also be a complication in many non-neurocritically ill patients [3], a situation which has led ICP monitoring to become a highly used modality in most intensive care units (ICUs). The importance of an adequate ICP monitoring rests in the fact that a sustained increase in ICP levels could lead to secondary lesions with life-threatening consequences for the patient [4]. Due to this fact several invasive ICP monitoring techniques have been developed with the objective of sensing pressure changes at the intra-ventricle cerebrospinal fluid, or directly within the parenchyma, among others.
Along with the ICP, many other physiological variables are continuously monitored during the patient stay at the ICU: electroencephalography (EEG), heart rate (HR), cerebral perfusion pressure (CPP) and arterial pressure among others. Most of the information gathered regarding the patient’s condition is analyzed in real time and very often the physician must confront redundant information. Only recently has this huge amount of data coming from ICU patients begun to be analyzed [5]. Modern computers and recent numerical techniques are capable of analyzing huge quantities of multimodal data, uncovering relationships that were previously hidden to the naked eye. Because of that, some relationships between physiological variables may have remained unnoticed until now. This is the case of the relationship between ICP and EEG activity. Some fragmented evidence of this relationship has begun to appear in recent years [6–10]. Correlations between ICP and EEG changes are found in patients during coma and sleep [9]. Changes in the ICP dynamics are linked to EEG bursts [7]. In the same fashion, correlations between ICP Lundberg waves and spectral bands in the EEG were found [10]. Lastly, a significant negative correlation between an index derived from the EEG and the ICP was also reported [8].
In the present work we give further support to the existence of an EEG-ICP relationship by quantifying the causal association between ICP dynamics and EEG activity in long-time monitoring recordings. The use of the Granger causality (GC) methodology applied to long recordings of ICP and EEG activity gathered from twenty-one patients suffering from TBI and subarachnoid hemorrhage (SAH) allowed us to expose the relationship between ICP dynamics and the electrical activity of the brain. As far as we know this is the first time that a causal relationship in such long-lasting recordings is exposed.
2.-Methodology
2.1. Patients
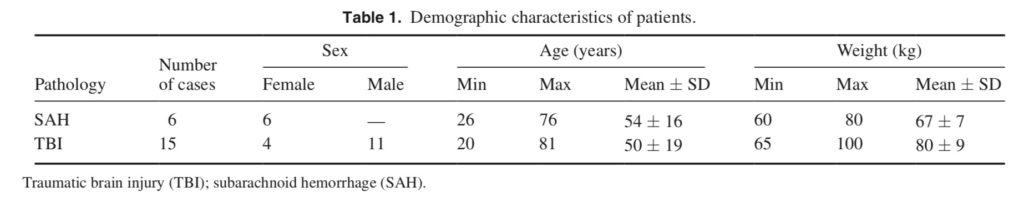
Twenty-one patients (ten women) suffering from TBI or SAH hospitalized at the ICU of the Hospital Universitario de la Princesa (HUP) between October 2015 and December 2017
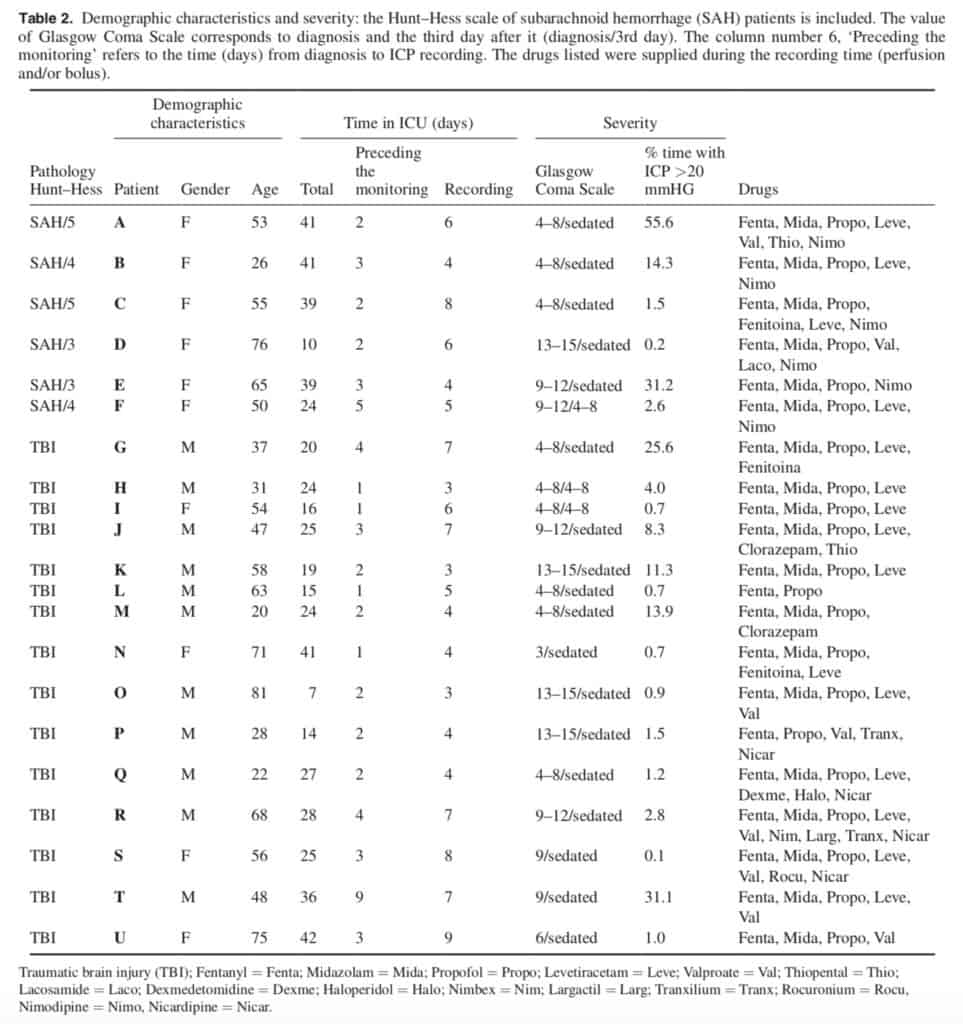
were recruited for this study. Eligible candidates included cases with continuous scalp EEG and ICP monitoring, according to HUP’s protocols. This research was approved by the HUP Ethics Committee and signed informed consent was obtained from patients’ relatives. Inclusion criteria for this study were: patients of either sex older than eighteen years, TBI or SAH, and clinical criteria for ICP monitoring. Exclusion requirements were: patients expected to stay less than one week, and no possibility of permanent EEG monitoring. Demographic characteristics of the enrolled patients are shown in table 1 and further clinical information can be found in table 2. EEG monitoring was performed with 19 scalp electrodes, in a standard 10–20 configuration, sampled at 500 Hz with a mono-polar montage referenced to the average midline electrodes, i.e. (Fz + Cz + Pz)/3. In this way, eight electrodes for each lateral side were employed, yielding a total of 16 EEG monopolar recordings for each patient. Recordings were filtered between 0.5 and 45 Hz. An average of 5.2 ± 2.3 d of continuous data were analyzed per patient. In addition, the electrocardiographic (ECG) signal, through the V3-lead, was recorded at 500 Hz and stored for further analysis. The ICP [11] was continuously monitored by using an intraparenchymal sensor and data stored for offline analysis. The almost-present ‘drift’ in the initial zero-calibrated pressure [12, 13] was corrected. A motion detection video camera was installed in the patient’s ICU room to track the patient’s head movements. The EEG computer and the ICP notebook were always time-synchronized at the beginning of each patient multimodal monitoring. Patient sedation, handling and bolus administration during the recording period was annotated and considered for further analysis. An overall of 2425 h of video and hourly annotated information of patients were analyzed, including 1866 h of EEG-ECG recordings and 1553 h of ICP. A total of 1055 h of simultaneous EEG-ICP recordings were analyzed. Gaps were present in the continuous data due to several factors such as CT scans, surgery and interruptions in the recording software, etc.
2.2. Data processing
Every continuous multivariate EEG recording was divided in temporal windows of 5 s in which several spectral measures
[14] were calculated. The temporal length of these non-overlapping windows was selected as a trade-off between being long enough to consider the EEG time series stationary and short enough to obtain a representative dynamical picture of the entire spectral evolution [14]. From all these measures, spectral entropy (SE), relative Delta (rDelta), Theta (rTheta) and Alpha (rAlpha) bands were selected in accordance with earlier unpublished results. rDelta, rTheta and rAlpha are the relative spectral power of these bands. If a spectral decomposition into the traditional frequency bands—Delta
(>0.5 Hz and &l;t4 Hz), Theta (4–7 Hz), Alpha (7–14 Hz), Beta (14–30 Hz) and Gamma (>30) —was performed, the relative power (RP) in each of the interested bands was calculated according to,

where P = rDelta + rTheta + rAlpha + rBetar + rGamma. The SE, which is the Shannon entropy of the signal’s power spectrum, has been proven to be a useful quantifier of the spectral content of a signal in different situations [14]. From the electrocardiogram waves, HR was also calculated, although
we do not provide details of this variable, in this work.
On the other hand, the ICP signal was stored at a sampling time of approximately 2.9s. A down-sampling from the original 2.9s to 5s was performed in order to construct a multivariate time series (see the following) by using these resampled ICP time series alongside the EEG measures. This down-sampling from 2.9 (0.35 Hz) to 5 s (0.2 Hz) allows one to obtain a unique and representative ICP value for each 5s window to compare to the EEG measures. The construction of a multivariate time series encompassing the spectral EEG measures and the ICP (and the ICP-diff) was performed by matching coincident times. In this way, a multivariate—EEG measures, HR and ICP—time series resampled at 5s steps
was finally built.
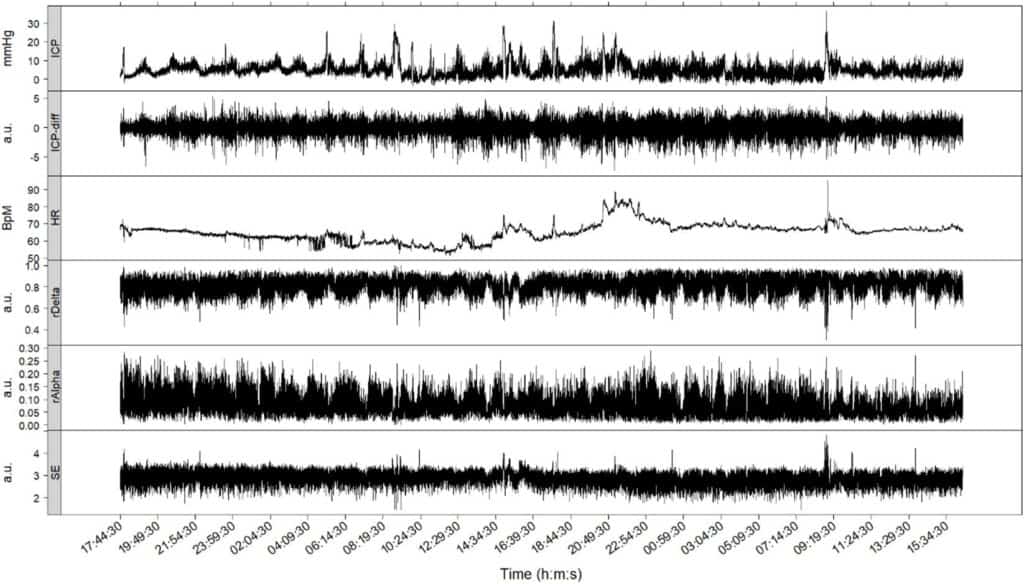
Figure 1 (patient I) displays typical time series of variables and measures during approximately 48h of continuous recording. The first three upper panels show the ICP, first-differences of the ICP (ICP-diff) and HR time series. The three lower panels show measures calculated from the EEG recordings, rAlpha, rDelta, and the SE.
2.3. Causality detection
The GC test [15–17] was used to quantify the potential dependence between the time series. The GC was evaluated between every pair of time series in temporal windows of 10 min.
Given two time series, x and y, the GC basically examines whether future values of one of the variables can be better predicted by using values from the other. Numerically, this can be assessed using auto-regressive models of order L to predict future values of x (xk) using past values of x or past values of both x and y, that is:

If the second prediction is better than the first one, it may be assumed that past values of y act on present values of x. The way to quantify this ‘better’ statistically is through the comparison between the errors εx and ε′x, for example using the statistic:

Where the Gy→x value is not negative and the larger the values of Gy→x the better the fit of the combined model, thus implying a stronger causality of y on x. The statistical significance of this equation can be evaluated through a Fisher test.

RSSx and RSS′x are the residual sums of the squares of the x and x + y models, respectively and Ndat was always equal to 120.
Roughly speaking, the GC test between two time series attempts to determine whether information borrowed from one of the time series is useful in predicting future values of the other. If the test produces confident results in one direction, say A → B, and not in the reverse direction, it may be assured the existence of a causal influence of A on B. Taking into account that the multivariate time series –rAlpha, rDelta, SE, and ICP were sampled at 5s, the evaluation of the GC was done by using 120 data points (twelve values per minute in 10min). Thus, in assessing the GC between each pair of time series, six GC values per hour and six more values for the inverse causality assumption were obtained. For every evaluation, a value of the statistic that quantifies the ‘causality strength’ and its statistical confidence were obtained. When a causality assessment was significant, these values were further considered, whereas zeros were assigned to non-significant values.
It is well-known that the GC test is severely flawed by the presence of non-stationarities in one or both time series [17]. By using the augmented Dickey–Fuller (DF) test in every time series and for every temporal window, non-stationarities were tested before using the GC test. In doing so, the null hypothesis of unit roots (of the auto-regressive models in (2)) was tested. Failure to reject this null hypothesis precluded the direct use of GC. Several time series, in particular the ICP signal, presented unit roots in many temporal windows. In view of that, first differences of these time series, ICP-diff, were used instead of the original ones. We therefore applied the GC on those time series that strictly verified the DF test. We will refer to the time series by their original names—ICP, rAlpha, etc.— considering that for the case of ICP, its first differences time series was used instead. Additionally, we also used a kind of inverse test, the Kwiatkowski–Phillips–Schmidt–Shin (KPSS) [17], to test stationarity. Therefore, the GC test was used in those pairs of time series which passed the DF and KPSS test. In those cases where one or both time series fail to pass one or both stationarity/non-stationarity tests, the GC was not performed. As in the case of non-significant GC assessment, a zero was assigned to the corresponding temporal window.
Lastly, both stationarity and causality strongly depend on the lag length L used in equation (2). Because we were testing several variables at once for selecting the optimal lag for each individual case, we fixed the lag lengths in three different values, L = 5, L = 10 and L = 15, instead of using particular criteria, e.g. Akaike Information Criterion for each individual case. These values were consistently used for testing stationarity and GC in all and every case.
2.4. Drug effects on GC assessment
With the objective of determining whether and to what extent sedation, patient’s handling and bolus administration affect GC calculations, several subsets of the entire patients’ recording were selected for additional analysis, namely:
– Subset total: whole patients’ recordings with simultaneous EEG and ICP measurements. 1055 h were analyzed
– Subset without bolus and handling: patients’ recording intervals with simultaneous EEG and ICP measurement but excluding those periods of bolus administration and
patient handling; 624 h were analyzed.
– Subset only bolus and handling: only those recording
intervals eliminated from the above subset. 431h were
analyzed;
– Subset stable: patients’ recording intervals during which
constant intravenous sedation was administered. 859h
were analyzed;
– Subset stable without bolus and handling: patients’
recordings with constant intravenous sedation but excluding those periods of bolus and handling. 490h were analyzed;
– Subset stable only bolus and handling: patients’ recordings with constant intravenous sedation and with periods of bolus and handling: 369 h were analyzed.
Intravenous patient sedation was annotated every hour. We thus considered stable sedation those periods longer than 3h without alterations. When handlings of the patient and/or bolus administration were considered, the period of 1 h centered at the manipulation time was considered and eventually eliminated.
3. Results
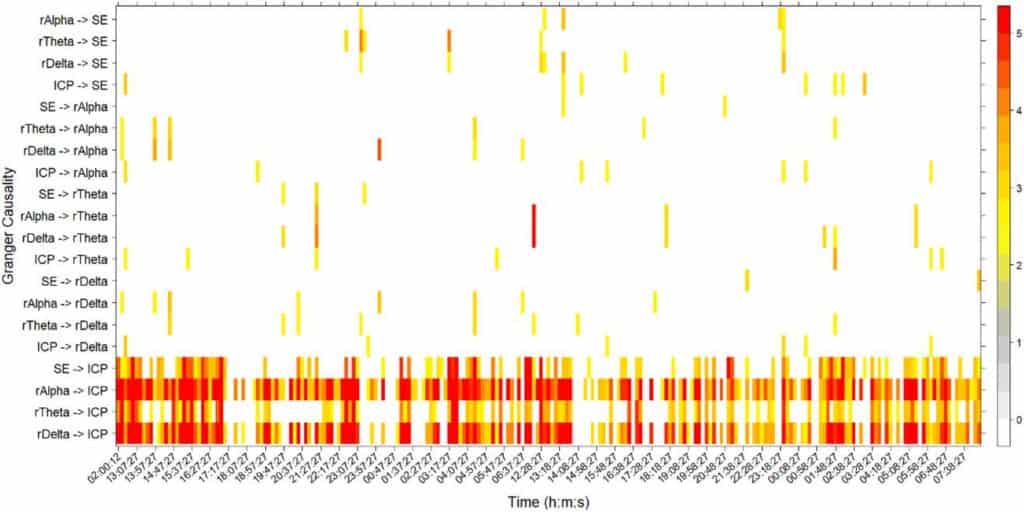
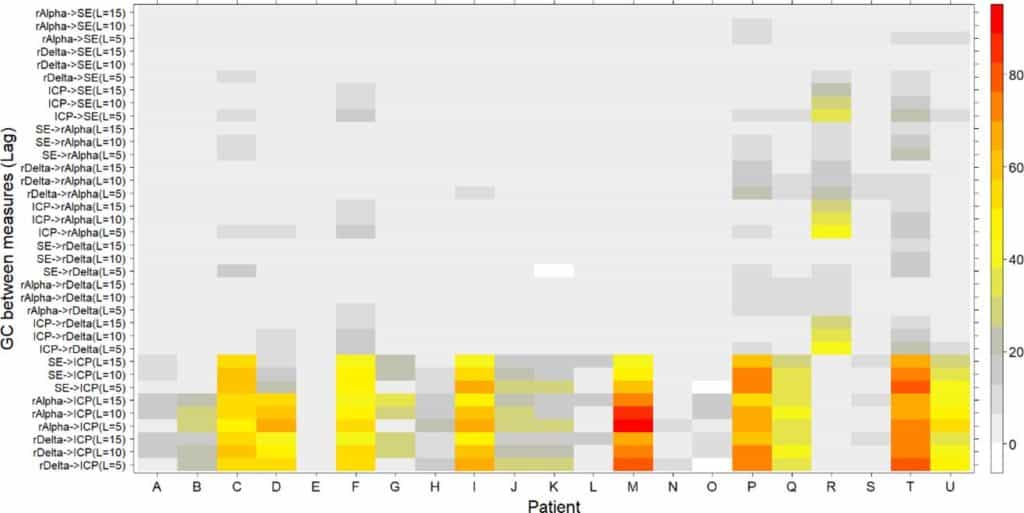
The potential dependence between EEG activity and ICP dynamics was numerically studied by analyzing GC between their corresponding time series. In order to do that, the GC test was calculated for all pairs of EEG measures (rAlpha, rTheta, rDelta, SE) and ICP signals. Figure 2 displays a typical causality assessment for a single patient (patient M) with lag = 10 (equation (2)). GC (equations (2)–(4)) was evaluated between rAlpha, rTheta, rDelta, SE and ICP, in both directions, during approximately 40 h of continuous monitoring. In figure 2 only significant (p < 0.05) Fisher statistics (equation (4)) are displayed for every 10 min temporal window. Values of the Granger statistic, Gx→y (equation (3)), greater than five were equalized to five for a better visualization. When one or both variables failed to pass the stationarity tests, a zero was assigned to the corresponding window. It is readily apparent the causal influence of the EEG measures on the ICP variable. This influence acts mainly in one direction and it is sustained most of the time. In figure 2 the time stamps in the x-axis ticks are equally spaced at 50 min. However, two large breaks exist, one between 02:00:12 and 13:07:27 (more than 11h) and the other between 06:37:27 and 12:28:27 (approximately 6h). These breaks in the continuous monitoring were produced by different circumstances as, for instance, moving the patient to other hospital services. The four EEG measures, SE, rAlpha, rTheta and rDelta seem to act roughly steadily on the ICP dynamics, although the influence of rAlpha and rDelta is stronger. In this particular case, significant GC covers more than 80% of the time in the case of rAlpha and more than 75% of the analysed time for rDelta. Henceforth, this measure— percentage of time with significant GC—will be used as the main indicator of causality assessment. Figure 3 shows the percentages of GC on the entire recording (total subset) for each patient, and for three different lag values: lags = 5, 10 and 15. In all but one patient (patient R), the percentages of GC in the direction EEG (rAlpha, rDelta, SE) → ICP were greater than the inverse ones. In most cases rather low or null causalities were found in the inverse direction (ICP → EEG), as it is apparent in the upper part of figure 3. Furthermore, the percentages of significant GC change, even on the same patient, depending on the lag used in the autoregressive models (equation (2)).
3.1. Analysis of subsets
Maximal values of percentages of time with significant GC are summarized in table 3. Results for three subsets are grouped in that table: total, without bolus and handling, only bolus and handling.
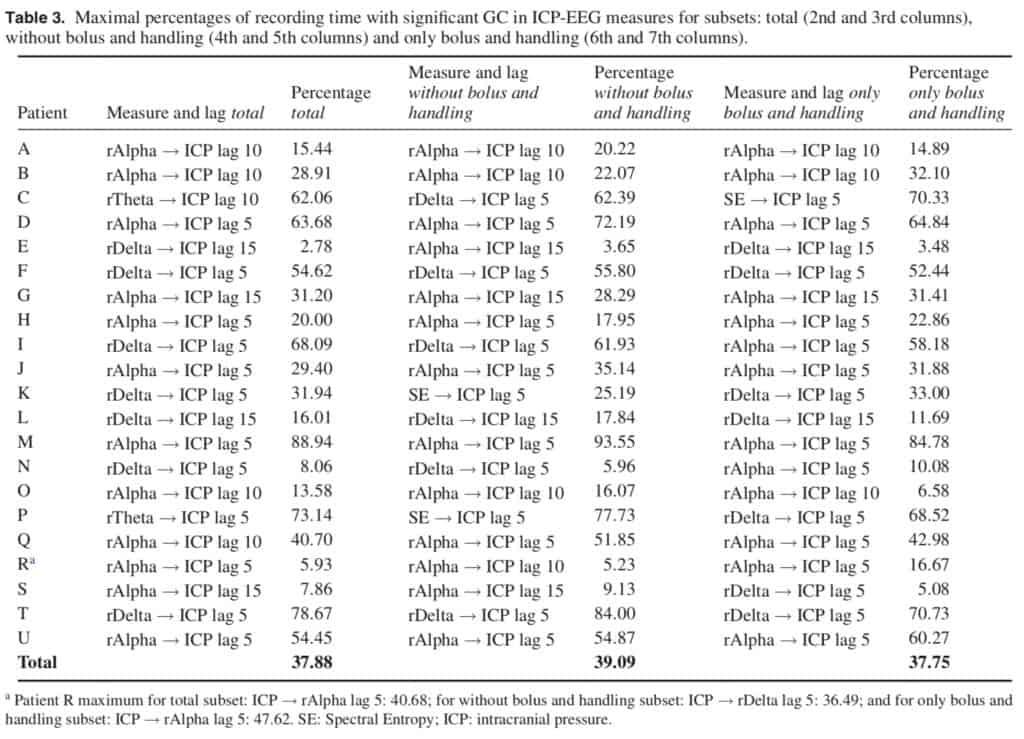
Subset total: In this subset eight out of 21 patients presented percentages of time with significant GC>50%. On average, the percentage of time with significant GC reached 37.88% considering the whole recording of all the patients. The highest percentages were found in rDelta (seven cases), rTheta (two cases) and rAlpha (12 cases). The most common lag was lag = 5 in 12 patients. Full results for the total subset of each patient are shown in supplementary table 1 (stacks.iop.org/JNE/15/066029/ mmedia).
Subset without bolus and handling: The average percentage for this subset reached 39.09% with nine out of 21 patients over 50%. Full results are shown in supplementary table 1 (stacks.iop.org/JNE/15/066029/mmedia).
Subset only bolus and handling: In this case, the percentage was 37.75%. Eight out of 21 patients presented percentages greater than 50%. Full results are shown in supplementary table 1 (stacks.iop.org/JNE/15/066029/ mmedia). Note that patient R maxima are found in the inverse direction.
Periods with constant intravenous sedation perfusion were analyzed in three different cases. Maximal values of percentages of time with significant GC are summarized in table 4.
Subset stable: The average percentage reached 37.84% with eight patients with more than 50%. Full results are shown in supplementary table 2 (stacks.iop.org/JNE/15/066029/ mmedia).
Subset stable without bolus and handling: The average percentage was 39.35% for all patients, with eight patients showing more than 50%. Full results are shown in supplementary table 2 (stacks.iop.org/JNE/15/066029/ mmedia).
Subset stable only bolus and handling: The average percentage was 38.60% for all patients with eight patients showing more than 50%. Full results are shown in supplementary table 2 (stacks.iop.org/JNE/15/066029/mmedia).
Results of sedation were similar for all subsets suggesting a low impact of bolus, handling and sedation on the GC findings. Only patient A presented remarkable changes between total and stable subsets. Notably, this consistency also remains for the lag and the measures that presented the highest percentages.
4. Discussion
To assess whether there is any relationship between EEG and ICP, the GC test was used on simultaneous EEG and ICP continuous—with gaps—recordings coming from TBI and SAH patients. Our results showed that most of the patients presented a flow of information from the EEG dynamics to the ICP which accounted for approximately 40% of the total (all patients) recording time. Nonetheless, in some patients (E, N, and S) this relationship was fairly weak or non-existent at all. Moreover, patient R presented a flow of information in the opposite direction, ICP → EEG. The pre-selected EEG measures rAlpha, rDelta, rTheta, and the SE presented significant GC with typical lags around 5–10 five-second-steps, equivalent to 25–50s. In order to stationarize the ICP time series, its first differences were used instead. This fact implies that the GC test was actually performed between the EEG measures and the ICP changes.
Unlike other related studies [6–10], the one presented here is based on the analysis of continuous long-lasting 5 s-sampled data from simultaneous recordings of ICP and EEG. These kinds of unique recordings allow us to expose the underlying EEG-ICP relationship.
Cerebral blood flow (CBF) is the key variable involved in preserving the normal functioning of the brain. However, controlling CBF levels around 50 ml/100 g min−1 is an extremely complicated and delicate task. Several variables—CPP, ICP, cerebrovascular resistance, mean arterial pressure—and also control mechanisms—myogenic, metabolic and neurogenic—are involved in cerebral autoregulation. Several works have linked one or several of these variables to EEG activity [6–10]. In line with these works, the findings presented here show the existence of a link between ICP and EEG. Moreover, they show that EEG activity actually precedes the ICP dynamics. This may seem counterintuitive at first since ICP changes would be expected to decrease CPP and thereby decrease CBF, which will in turn affect brain tissues and their electrical activity. This would imply a flow of information from ICP to EEG. On the contrary, our results show an inverse directionality and the only explanation we have is that what we are actually seeing is the neurogenic control of the ICP. Neurovascular coupling between brain electrical activity and vascular response has been exposed recently in ICU patients as well [6, 7]. For instance, simultaneous recordings of both depth-electrodes and ICP were analyzed in two patients with TBI and SAH [6]. The existence of a correlation was found between amplitude changes in the ICP and EEG bursts and a delay of 8.1s between them, with the changes in ICP amplitude appearing after EEG bursts.
Several limitations of the present study should be mentioned. One is the low number of patients enrolled in the study, limited to only TBI and SAH pathologies. Another issue is the existence of ‘perturbations’ affecting the ICP, EEG, or both simultaneously. These are, for instance, sedatives, intracranial antihypertensive agents, and anti-epileptic drugs [18–27] administered during the monitoring periods. Although this point has been partially considered here, several important questions remain to be addressed. From a methodological point of view, the linear character of the GC methodology should be highlighted, basedonlinearregressionmodels(equation(2)),whichprevent one from detecting nonlinear interactions. Nonlinear relationships between the ICP and the EEG measures would therefore yield null CG values. The use of nonlinear causality methods, e.g. transfer entropy, nonetheless requires a larger number of datapointstobeusedthanthe120weusedineachtemporal window, a fact which hinders its application in our case.
Which drug (or drugs) interrupts the GC? It has been shown that all the analyzed recordings present periods in which the GC disappears or decreases its intensity. If the GC between ICP and EEG is an indicator of neurovascular coupling, as we have hypothesized, this must be related to a blocking effect on this coupling. Several anesthetics are known to affect the neurovascular coupling [28]. Thus, a detailed and thorough study of the effect of these kinds of drugs on the ICP-EEG GC is still lacking. In the same fashion, we have not yet studied how intracranial hypertension (ICP > 20 mmHg) affects the GC. This is an important point because, under normal physiological ICP, the neurogenic control is competing with the myogenic and metabolic mechanisms. But it is unknown which CBF regulation mechanism prevails under this pathological condition. The study of these important issues, the effects of both anesthetics and intracranial hypertension on the GC, is now underway.
The existence of several complications, such as the breakage of the optical fiber or dislocations of the fixation screw (or the probe itself) which could occur during the monitoring period, should also be mentioned [29]. Moreover, when using intraparenchymal probes, as in our case, a gradient of the ICP levels exists depending on the proximity of the probe to the lesion area [30]. Although we were unable to determine how these issues affect the final calculations, certainly they introduce new uncertainties in the calculations. Altogether, the best we could do to obtain more robust results was eliminating those periods of recording affected by these situations, even at the expense of reducing the number of analyzed hours. In doing so, we observed that the mean percentage of significant GC for all patients increased from 37.88% (in 1055 h) up to 72% (in 288 h).
5. Conclusion
Long-lasting, continuous and simultaneous EEG and ICP recordings from TBI and SAH patients provided highly rich and useful information, which allowed us to uncover a strong relationship between both signals. Although further research is certainly needed on this issue, the use of this relationship might help in developing a medical device to measure ICP in a non-invasive way.
Acknowledgments
This work was funded by grants from Instituto de Salud Carlos III (PI10/00160 and PI12/02839), partially supported by Fondo Europeo de Desarrollo regional (F.E.D.E.R) and from Mutua Madrileña. AS-G is the recipient of a postdoctoral fellowship from Mutua Madrileña. MP-R is the recipient of an Ayudante de investigation fellowship from Comunidad de Madrid.
Ethical standards
The study has been approved by the hospital’s ethics committee.
Conflicts of interest
The authors declare that they have no conflict of interest.
ORCID iDs
Ancor Sanz-García
https://orcid.org/0000-0002-5024-5108
References
[1] Kishore P R, Lipper M H, Becker D P, Domingues da Silva A A and Narayan R K 1981 Significance of CT in head injury: correlation with intracranial pressure Am. J.Roentgenol. 137 829–33
[2] Miller J D, Butterworth J F, Gudeman S K, Faulkner J E, Choi S C, Selhorst J B, Harbison J W, Lutz H A, Young H F and Becker D P 1981 Further experience in the management of severe head injury J. Neurosurg. 54 289–99
[3] Rangel-Castillo L, Gopinath S and Robertson C S 2008 Management of intracranial pressure Neurol. Clin. 26 521–41
[4] Marmarou A, Anderson R L, Ward J D, Choi S C, Young H F, Eisenberg H M, Foulkes M A, Marshall L F and Jane J A 1991 Impact of ICP instability and hypotension on outcome in patients with severe head trauma J. Neurosurg. 75 S59–S66
[5] Celi L A, Mark R G, Stone D J and Montgomery R A 2013 ‘Big data’ in the intensive care unit. Closing the data loop Am. J. Respir. Crit. Care Med. 187 1157–60
[6] Connolly M, Vespa P, Pouratian N, Gonzalez N R and Hu X 2015 Characterization of the relationship between intracranial pressure and electroencephalographic monitoring in burst-suppressed patients Neurocrit. Care 22 212–20
[7] Connolly M, Liou R, Vespa P and Hu X 2016 Identification of an intracranial pressure (ICP) response function from continuously acquired electroencephalographic and ICP signals in burst-suppressed patients Intracranial Pressure and Brain Monitoring XV. Acta Neurochirurgica Supplement vol 122 ed B T Ang (Cham: Springer) pp 225–8
[8] Chen H, Wang J, Mao S, Dong W and Yang H 2012 A new method of intracranial pressure monitoring by EEG power spectrum analysis Can. J. Neurol. Sci. 39 483–7
[9] Munari C and Calbucci F 1981 Correlations between intracranial pressure and EEG during coma and sleep Electroencephalogr. Clin. Neurophysiol. 51 170–6
[10] Lescot T, Naccache L, Bonnet M P, Abdennour L, Coriat P and Puybasset L 2005 The relationship of intracranial pressure Lundberg waves to electroencephalograph fluctuations in patients with severe head trauma Acta Neurochir. 147 125–9
[11] Kirkman M A and Smith M 2013 Intracranial pressure monitoring, cerebral perfusion pressure estimation, and ICP/CPP-guided therapy: a standard of care or optional extra after brain injury? Br. J. Anaesth. 112 36–46
[12] Martínez-Mañas R M, Santamarta D, de Campos J M and Ferrer E 2000 Camino® intracranial pressure monitor: prospective study of accuracy and complications J. Neurol. Neurosurg. Psychiatry 69 82–6
[13] Zacchetti L, Magnoni S, Di Corte F, Zanier E R and Stocchetti N 2015 Accuracy of intracranial pressure monitoring: systematic review and metaanalysis Crit. Care 19 420
[14] Sanz-García A, Vega-Zelaya L, Pastor J, Sola R G and Ortega G J 2017 Towards operational definition of postictal stage: spectral entropy as a marker of seizure ending Entropy 19 81
[15] Granger C W 1969 Investigating causal relations by econometric models and cross-spectral methods Econometrica 36 424–38
[16] Bressler S L and Seth A K 2011 Wiener–Granger causality: a well-established methodology NeuroImage 58 323–9
[17] Toda H Y and Yamamoto T 1995 Statistical inference in vector autoregressions with possibly integrated processes J. Econometr. 66 225–50
[18] Huang Z, Dong W, Yan Y, Xiao Q and Man Y 2002 Effects of intravenous mannitol on EEG recordings in stroke patients Clin. Neurophysiol. 113 446–53
[19] Purdon P L, Sampson A, Pavone K J and Brown E N 2015 Clinical electroencephalography for anesthesiologists part i: background and basic signatures Anesthesiology 123 937–60
[20] Kuizenga K, Wierda J M and Kalkman C J 2001 Biphasic EEG changes in relation to loss of consciousness during induction with thiopental, propofol, etomidate, midazolam or sevoflurane Br. J. Anaesth. 86 354–60
[21] Brown C R, Sarnquist F H, Canup C A and Pedley T A 1979 Clinical electroencephalographic and pharmacokinetic studies of water-soluble benzodiazepine, midazolam maleate Anesthesiology 50 467–70
[22] Sebel P S, Bovill J G, Wauquier A and Rog P 1981 Effects of high dose fentanyl anesthesia on the electroencephalogram Anesthesiology 55 203–11
[23] Albrecht R F, Miletich D J, Rosenberg R and Zahed B 1977 Cerebral blood flow and metabolic changes from induction to onset of anesthesia with halothane or pentobarbital Anesthesiology 47 252–6
[24] Colton K, Yang S, Hu P F, Chen H H, Bonds B, Scalea T M and Stein D M 2014 Intracranial pressure response after pharmacologic treatment of intracranial hypertension J. Trauma Acute Care Surg. 77 47–53
[25] Sperry R J, Bailey P L, Reichman M V, Peterson J C, Petersen P B and Pace N L 1992 Fentanyl and sufentanil increase intracranial pressure in head trauma patients Anesthesiology 77 416–20
[26] Roberts D J, Hall R I, Kramer A H, Robertson H L, Gallagher C N and Zygun D A 2011 Sedation for critically ill adults with severe traumatic brain injury: a systematic review of randomized controlled trials Crit. Care Med. 39 2743–51
[27] Papazian L, Albanese J, Thirion X, Perrin G, Durbec O and Martin C 1993 Effect of bolus doses of midazolam on intracranial pressure and cerebral perfusion pressure in patients with severe head injury Br. J. Anaesth.71 267–71
[28] Franceschini M A, Radhakrishnan H, Thakur K, Wu W, Ruvinskaya S, Carp S and Boas D A 2010 The effect of different anesthetics on neurovascular coupling NeuroImage 51 1367–77
[29] Gelabert-Gonzalez M, Ginesta-Galan V, Sernamito-
Garcia R, Allut A G, Bandin-Dieguez J and Rumbo R M 2006 The Camino intracranial pressure device in clinical practice. Assessment in a 1000 cases Acta Neurochir. 148 435–41
[30] Wolfla C E, Luerssen T G, Bowman R M and Putty T K 1996 Brain tissue pressure gradients created by expanding frontal epidural mass lesion J. Neurosurg. 84 642–7